Rose Garden or Willow Glen: Why the Lower Price Doesn't Mean the Better Deal
Ask a buyer comparing San Jose's two most talked-about in-town neighborhoods which one costs more, and most will point to Willow Glen. Its median sale price sits higher. Its listings photograph like main street postcards. It has a reputation to match the price tag.
Then look at what you actually get for the money, and the story flips. As of March 2026, Rose Garden's median sale price was $1,635,000, well below Willow Glen's $1,867,500. But Rose Garden was commanding $1,160 per square foot compared to Willow Glen's $1,080. The neighborhood with the lower sticker price was the more expensive one, square foot for square foot.
That contradiction is the whole story here, and it matters if you're trying to figure out which of these two historic San Jose districts actually fits your budget for the size of home you want.
A median sale price answers one question: what did the typical home sell for. It says nothing about how big that home was. Price per square foot answers a different question: what did each square foot of that home cost. When those two numbers point in opposite directions, as they do here, the median is hiding something.
Here's how the two neighborhoods compared as of March 2026:
| Metric (March 2026) | Rose Garden | Willow Glen |
|---|---|---|
| Median sale price | $1,635,000 | $1,867,500 |
| Price per square foot | $1,160 | $1,080 |
| Median days on market | 10 | 10 |
| Sale-to-list ratio | 102.9% | 105.2% |
| Share of homes selling over list | 57.1% | 63.4% |
Both neighborhoods moved fast and sold over asking. Neither is a soft market. But the gap between median price and price per square foot tells you the homes changing hands in each district are not the same size, and that difference is doing more work than most listing summaries let on.
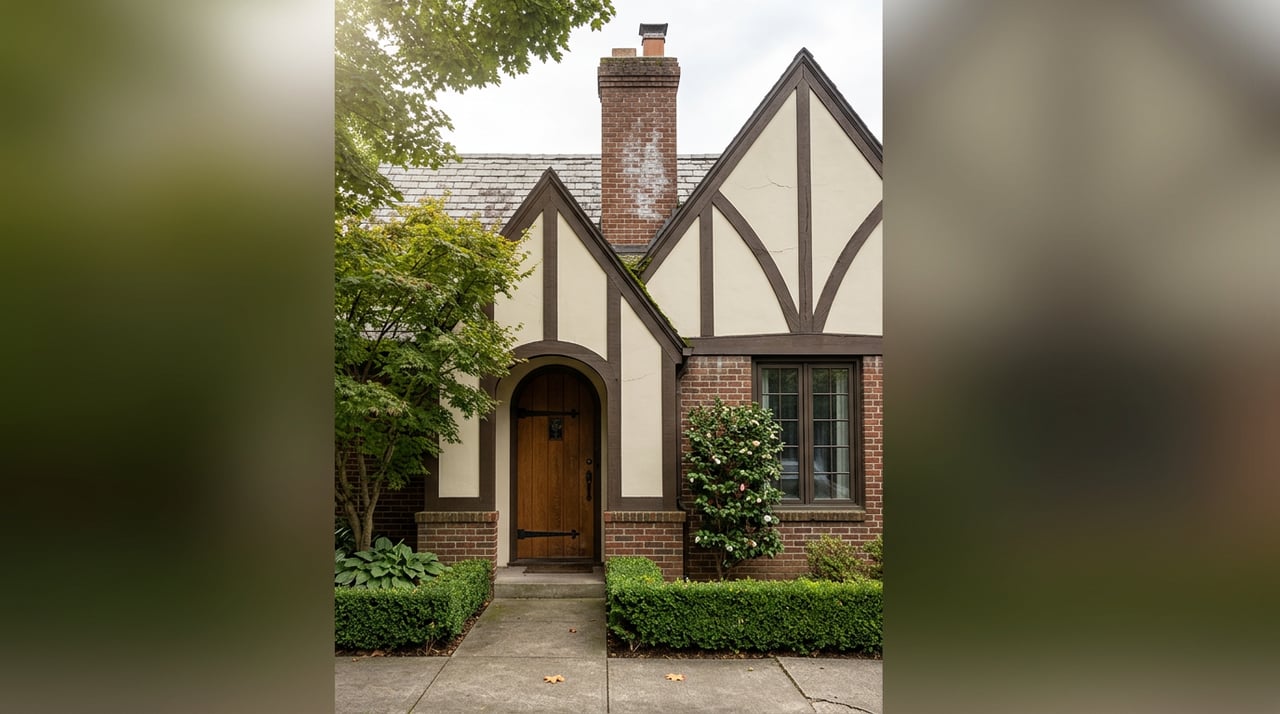
Rose Garden earns its per-square-foot premium partly because of what surrounds it and partly because of what it is. The district takes its name from the San Jose Municipal Rose Garden, a 5.5-acre park the city bought in 1927 and dedicated a decade later, later named America's Best Rose Garden in 2010. A few blocks away sits Rosicrucian Park, home to the Rosicrucian Egyptian Museum and its planetarium, and the Historic Hoover Theatre. The housing stock is old by Bay Area standards: Victorians from the 1860s and 1870s still stand along Magnolia, Hester, and Hedding Streets, and much of the rest of the district was built out in the 1920s and 1930s after a local orchard owner subdivided his land into residential lots. Buyers researching the area quickly learn it splits into named micro-pockets, among them Hanchett Park and the Chapman and Davis blocks, each with its own mix of home ages and lot sizes.
What that adds up to is a neighborhood where the homes themselves tend to be smaller and older, and where a meaningful share of what a buyer is paying for is the lot, the address, and proximity to two civic landmarks that aren't going anywhere. You're buying land and location more than you're buying square footage.
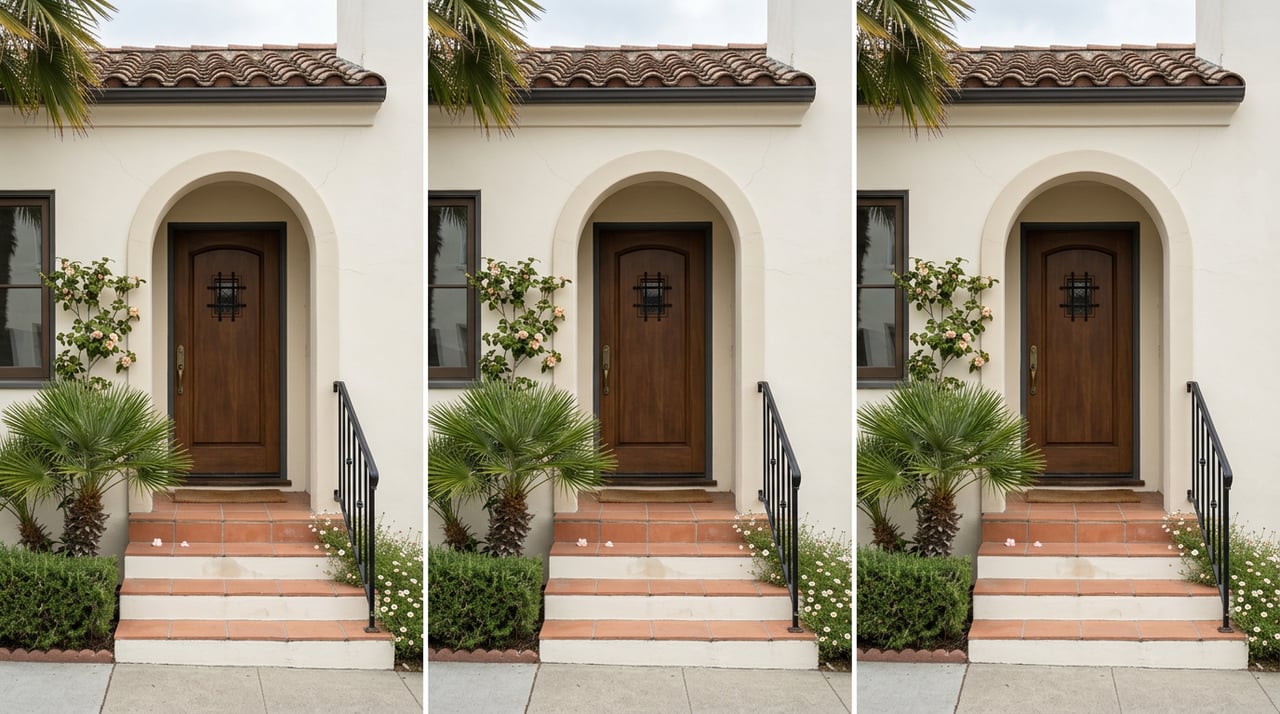
Willow Glen sells a different proposition. It's bordered by the Guadalupe River, Los Gatos Creek, and the city of Campbell, and its identity runs through Lincoln Avenue, the walkable main street strip of restaurants and small shops that anchors the district. The homes are also period pieces, mostly Spanish-style and Craftsman bungalows from the 1920s through the 1940s, but the district has absorbed more remodeling and rebuilding over the decades, and the typical home that sells there tends to be larger than its Rose Garden counterpart. You're paying more in total, but you're also getting more house.
Neither answer is objectively better. They're just different trades, and the price-per-square-foot gap is the clearest evidence of which trade you're actually making.
There's a second wrinkle worth knowing before you lean on any single Willow Glen price figure. In March 2026, Willow Glen's median sale price was down 6.1 percent compared to the same month a year earlier, even as the neighborhood's average sale price, measured in the most recent month reported, was up more than 12 percent year over year.
A median and an average moving in opposite directions almost always means the mix of what sold changed, not that values themselves reversed course. Willow Glen isn't a single, uniform market. It's better described as a patchwork of smaller pockets, from North Willow Glen and Palm Haven to the Dry Creek area and St. Francis Woods, each with its own price behavior depending on school boundaries, lot size, and how recently homes have been updated. If a run of large, heavily remodeled sales closes in one stretch of months while more modest, dated homes make up a bigger share of the middle of the market, the average can climb even as the typical sale price cools. For a buyer, that means a Willow Glen "average price" you find online may be describing a different kind of home than the one you're shopping for.
Rose Garden carries its own version of this trap, and it comes down to volume. In August 2025, the neighborhood's median sale price was $2.2 million, up 32.1 percent year over year, on just twelve recorded sales, up from only three the year before. That's not a sign the neighborhood suddenly got dramatically more expensive. It's a sign that when a historic district covering only a few square city blocks has a thin month of closings, one or two high-end sales can swing the median by double digits.
If you're comparing a Rose Garden listing against a single month's median, you're comparing it against a number that a handful of transactions built. A multi-month trend, or a conversation about what's actually closed recently in the specific pocket you're considering, tells you far more than one month's headline figure.
Both neighborhoods sit well above San Jose's overall median sale price, which was near $1.5 million over the three months ending June 2026 in a citywide market that has been cooling gradually since its spring peak. That citywide softening doesn't erase the premium either district commands. It just means the comparison between Rose Garden and Willow Glen is happening inside a market that has more room to negotiate than it did a year ago.
Is Rose Garden or Willow Glen more competitive for buyers right now? As of March 2026, both scored identically on Redfin's competitiveness measure and both had a 10-day median time on market. Willow Glen's slightly higher share of over-list sales, 63.4 percent versus 57.1 percent, suggests a bit more bidding pressure on any given listing, but the two districts were close.
Why would a neighborhood's median price fall while its average rises? It usually means the mix of homes selling changed rather than values reversing. A cluster of large, updated sales can lift an average even while the typical, more modest sale is cooling. Always ask what specifically sold before treating either number as the full picture.
How many homes actually change hands in Rose Garden in a given month? It can be a small number. Twelve sales closed there in August 2025, up from three the year before. In a district covering only a few square blocks, that thin volume means single-month comparisons can swing hard. Multi-month trends and pocket-specific data hold up better than one month's snapshot.
If you're weighing Rose Garden against Willow Glen, or trying to make sense of a price-per-square-foot figure that doesn't match the headline median you found, that's exactly the kind of read Yuri Lavrentiev works through with buyers across San Jose every week. Let's connect and figure out which neighborhood actually fits what you're trying to buy.
Stay up to date on the latest real estate trends.
Yuri provides elevated representation, refined marketing strategies, and skilled negotiation designed to protect and maximize your investment. With a tailored approach for each client, every property receives white-glove service and every transaction is executed at the highest level.
Yuri Lavrentiev | CA DRE# 02103193
1133 Minnesota Ave San Jose, CA 95125